How Inflation Works: What the Official Data Says About Rising Prices
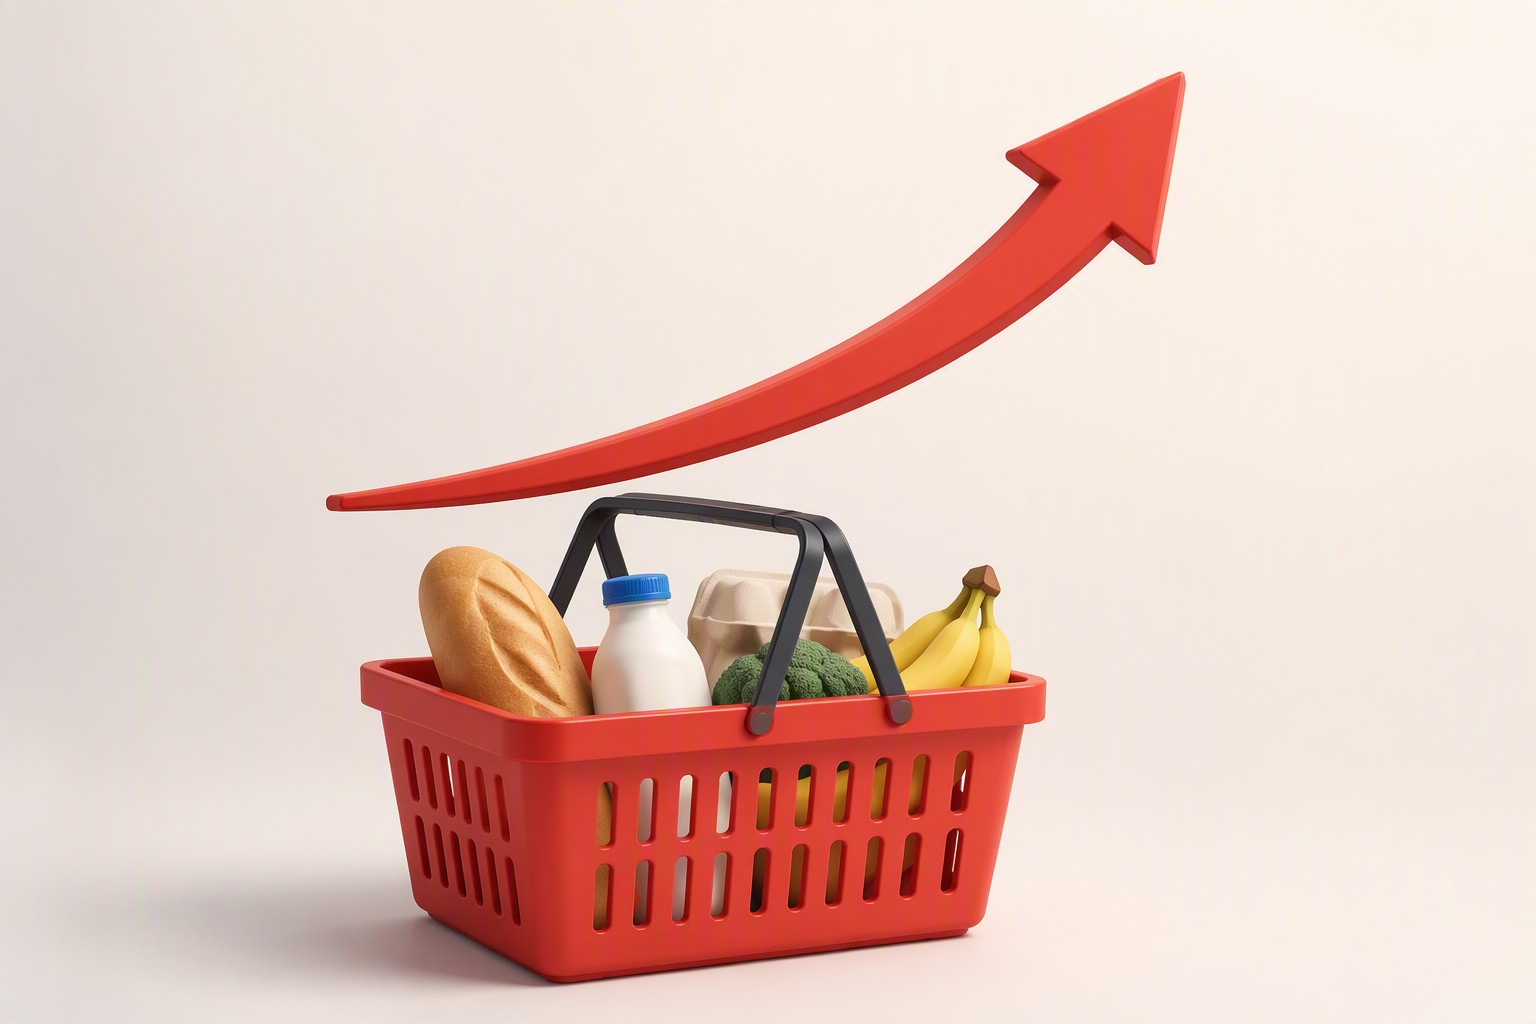
You may have noticed it at the grocery store first: the same cart costs more than it did last year, even though you bought the same things. That feeling has an official name, an official measurement, and a government agency that tracks it down to the decimal. Inflation is one of the most discussed — and most misunderstood — forces in the economy. Here is what it actually is, how it is measured, and what the latest official data shows.
Quick answer: Inflation is a general increase in the price level of goods and services over time, as defined by the Federal Reserve. It is measured primarily by the Consumer Price Index (CPI), published monthly by the U.S. Bureau of Labor Statistics (BLS). The latest official data shows consumer prices rose 3.4% over the 12 months ending July 2026, with core inflation (excluding food and energy) at 2.5%. The Federal Reserve targets a long-run inflation rate of 2%, considering it most consistent with stable prices and maximum employment.
What Is Inflation, Exactly?
The Federal Reserve defines inflation simply: “Inflation is the increase in the prices of goods and services over time.” Crucially, the Fed adds, inflation cannot be measured by the rising cost of one product or even several products — it is “a general increase in the overall price level of the goods and services in the economy.”
That distinction matters. A 30% spike in one item (say, a weather-damaged vegetable crop) is not inflation — it is a relative price change. Inflation is when the average price of the things people actually buy drifts upward broadly, and it is that broad, persistent drift that erodes the purchasing power of money.
How Is Inflation Measured?
The primary U.S. measure is the Consumer Price Index (CPI), published monthly by the Bureau of Labor Statistics. The BLS describes it as “a measure of the average change over time in the prices paid by urban consumers for a market basket of consumer goods and services.”
The methodology behind the headline number is genuinely meticulous:
- Coverage. The CPI reflects spending patterns of all urban consumers — over 90% of the U.S. population — including professionals, retirees, the unemployed, and the self-employed.
- Data collection. Each month, BLS price collectors gather data in 75 urban areas across the country, from about 6,000 housing units and approximately 22,000 retail establishments — supermarkets, department stores, hospitals, and other outlets.
- The market basket. Prices are tracked for the goods and services people buy for day-to-day living: food, shelter, clothing, fuels, transportation, medical services, drugs, and more.
- The base year. Index levels are expressed relative to a reference period — for the CPI-U, the base is 1982–84 = 100. An index of 333.918, the July 2026 level, means the same basket that cost $100 in 1982–84 now costs roughly $334.
Because the CPI is a sample (not a census of every price in the economy), the BLS publishes statistical error estimates alongside the data — the estimated standard error of the one-month change is about 0.04 percentage points, a reminder that even official numbers carry measurement uncertainty.
What Does the Latest Official Data Show?
The most recent release — the CPI for July 2026, published August 12, 2026 — shows a picture worth reading carefully:
| Measure | July 2026 (monthly) | 12 months ending July 2026 |
|---|---|---|
| All items (CPI-U) | +0.1% (seasonally adjusted) | +3.4% |
| All items less food and energy (core) | +0.2% | +2.5% |
| Food | +0.1% | +3.0% |
| Energy | −1.5% | +14.7% (gasoline +24.6%) |
| Shelter | +0.1% | +3.2% |
Three observations stand out from the BLS release:
- Shelter dominates the monthly move. The shelter index rose 0.1% in July and “accounted for roughly two-thirds of the monthly all items increase” — housing costs are the heavy weight in most household budgets, so they move the headline.
- Energy is volatile and loud. Energy prices fell 1.5% in July alone, yet gasoline rose 24.6% over the year. This is exactly why economists strip out food and energy when looking for trends — these categories swing wildly month to month.
- Core inflation is the calmer signal. At 2.5% over 12 months, the core index (excluding food and energy) sits much closer to the Federal Reserve’s 2% long-run objective than the headline number suggests.
Why Do Prices Rise in the First Place?
Economists generally group the drivers of inflation into three mechanisms:
- Demand-pull inflation. When households and businesses want to buy more than the economy can produce at current prices, sellers raise prices. Strong demand meets limited supply.
- Cost-push inflation. When the inputs to production get more expensive — energy, labor, raw materials — producers pass those costs on to consumers. The recent 24.6% rise in gasoline is a textbook example of an energy-driven cost push rippling through the economy.
- Expectations. If people expect prices to keep rising, they demand higher wages and buy sooner rather than later, which can make inflation self-reinforcing. This is why central banks treat anchored expectations as almost as important as the inflation rate itself.
The Federal Reserve’s role is defined by its dual mandate: maximum employment and price stability. The Federal Open Market Committee (FOMC) has affirmed that a 2% annual increase in the PCE price index “is most consistent over the longer run” with that mandate. When households and businesses can reasonably expect inflation to stay low and stable, the Fed explains, “they are able to make sound decisions regarding saving, borrowing, and investment.”
What Is Core Inflation and Why Do Economists Watch It?
Core inflation excludes items that “tend to go up and down in price dramatically or often, like food and energy items,” per the Federal Reserve. The logic is subtle but important: a large change in volatile categories (a bad harvest, an oil shock) does not necessarily persist, while a sustained rise in core prices signals something more structural.
That is why the July 2026 data is genuinely informative: headline inflation at 3.4% sounds far from target, but the core reading of 2.5% tells policymakers that the persistent, underlying trend is much closer to the Fed’s 2% objective — with the gap between the two largely explained by energy prices.
Why Does Inflation Matter for Your Money?
Inflation is a silent tax on cash. If prices rise 3.4% while your savings earn 0.5%, your purchasing power shrinks by roughly 3% each year — money sitting in a zero-interest account loses value in real terms even though the number on the screen never changes.
This connects directly to the mechanics of saving: compound interest grows nominal balances, but inflation determines what those balances can actually buy. A retirement goal of $500,000 today is a different target in 20 years if inflation averages 3% — the same math that makes starting early powerful also makes inflation the quiet variable every long-term plan must price in.
The Fed’s 2% target exists partly for this reason: a low, stable, predictable inflation rate lets households make sound saving, borrowing, and investment decisions without guessing what a dollar will be worth next decade.
What Can You Actually Do About Inflation?
No individual can “fix” inflation — it is a macroeconomic phenomenon managed by the Federal Reserve. But the data points to sensible personal adjustments:
- Track it against your own basket. The CPI is an average; your personal inflation rate depends on what you buy. If you rent, drive a lot, or buy groceries heavily, your experience differs from the headline.
- Keep emergency savings ahead of inflation. Cash reserves are essential for safety, but they lose purchasing power in real terms — size them for what emergencies actually cost now, and review them yearly.
- Understand wage growth vs. price growth. The BLS publishes both sides of the ledger; whether households feel “ahead” depends on whether wages outpace prices, not on either number alone.
- Expect policy to lag. The Fed’s policy “works with a lag,” as its own FAQ notes — effects of rate changes show up in prices over time, not immediately.
Frequently Asked Questions
Is inflation always bad? No. Very low or negative inflation (deflation) discourages spending and investment, which can deepen recessions. The Federal Reserve targets 2% inflation deliberately — low and stable, not zero.
What is a “normal” inflation rate? The Federal Reserve’s FOMC has affirmed 2% annual inflation (PCE basis) as most consistent with its mandate over the long run. Inflation near that level is considered normal and healthy.
Why is my grocery bill rising faster than the headline rate? The headline CPI is a weighted average. Food rose 3.0% over the year ending July 2026, but individual categories varied widely — fruits and vegetables rose 5.1% while dairy fell 0.5%. Your personal basket determines your personal rate.
What causes inflation? Economists group causes into demand-pull (too much spending chasing too little supply), cost-push (rising input costs like energy passed to consumers), and expectations (self-fulfilling wage-price spirals).
Can inflation hurt savers? Yes. If inflation exceeds the interest your savings earn, your money loses real purchasing power. This is why the Fed aims for low, stable inflation — predictability lets savers plan.
How do I know what inflation is right now? The BLS publishes the CPI monthly (with data and methodology on bls.gov/cpi), and the Fed publishes its preferred PCE measure monthly as well. FRED, the St. Louis Fed’s data platform, lets anyone chart both series over decades.
The Takeaway
Inflation is not a mystery or a rumor — it is a carefully measured statistical reality, published every month with documented methods and error bounds. The July 2026 data tells a coherent story: headline inflation at 3.4%, energy doing most of the shouting, and core inflation at 2.5% trending toward the Fed’s 2% target. Understanding how the number is built — the market basket, the 75 cities, the 22,000 stores, the volatile items stripped out of core — is the difference between reacting to headlines and actually reading the economy.
Sources: U.S. Bureau of Labor Statistics — Consumer Price Index (CPI); BLS — Consumer Price Index Summary, July 2026; BLS — CPI Frequently Asked Questions; Federal Reserve — What is inflation, and how does the Federal Reserve evaluate changes in the rate of inflation?; Federal Reserve — Why does the Federal Reserve aim for 2 percent inflation over time?; FRED — Consumer Price Index for All Urban Consumers (CPIAUCSL)









Leave a comment